Performance baseline
This page records a cross-host RDMA performance baseline for the PeerCache
GET path (one-sided RDMA READ of KV pages, MLA layout) measured with the
built-in peercache-bench serve / drive two-node harness. It shows three
regimes and what bounds each:
- a single NIC (PeerCache vs. bare
ib_read_bw), - a single process across many NICs (multi-rail), and
- the full machine (multi-process across all NICs).
These are example numbers from one cluster
The figures below come from one specific 8-NIC RoCE setup (see Test environment). Treat them as a methodology and shape-of-the-curve reference, not a guarantee — re-run on your hardware with the commands in Reproduce.
Headline
| Scenario | GET throughput | vs. single-NIC bare | notes |
|---|---|---|---|
Bare ib_read_bw, 1 NIC, 16 QP |
49.0 GB/s (392 Gbps) | 100% | hardware ceiling of one NIC |
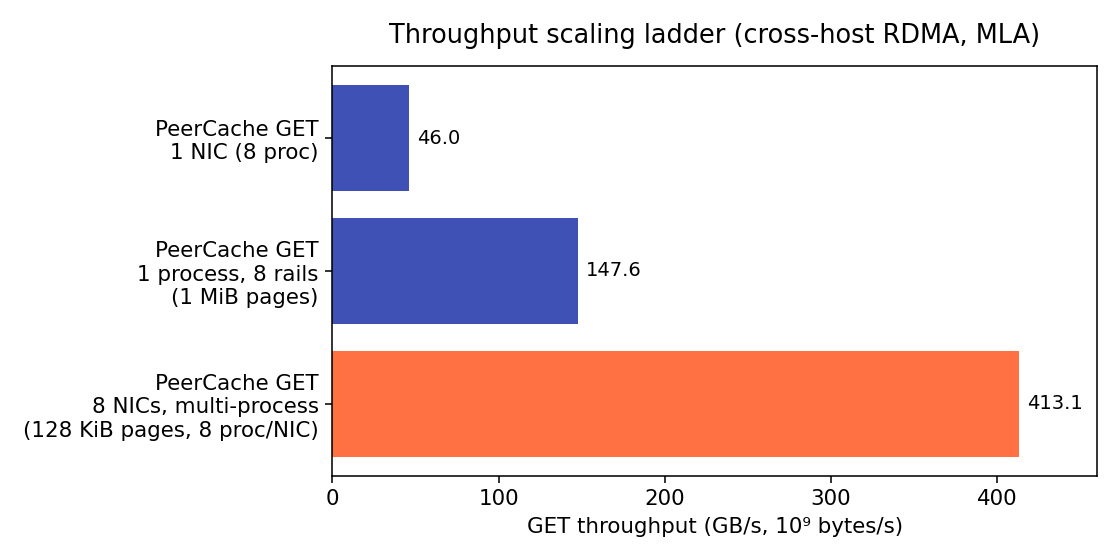
| PeerCache, 1 NIC, 8 processes | 46.0 GB/s (368 Gbps) | 94% | storage-layer overhead ≈ 6% |
| PeerCache, 1 process, 8 rails, 1 MiB pages | 147.6 GB/s (1.18 Tbps) | — | GIL-bounded; ≈ 3 NICs' worth |
| PeerCache, 8 NICs, multi-process, 128 KiB pages | 413.1 GB/s (3.3 Tbps) | — | per-NIC 25–89 GB/s; mem/PCIe/NUMA-bound |
The takeaway: PeerCache reaches ~94% of bare ib_read_bw on a single NIC,
and a single box scales to 0.41 TB/s aggregate across 8 NICs. (Under full
multi-process load a single NIC reached 89 GB/s — the 16-QP ib_read_bw
figure above is a conservative single-NIC reference, not a hard cap.)
Test environment
| item | value |
|---|---|
| Topology | 2 hosts (producer / consumer), cross-node RoCE |
| NICs | 8 × Mellanox mlx5 RoCE, bonded (mlx5_bond_1..8) |
| RoCE | RoCEv2, GID index 3, MTU 4096 |
| Single-NIC line rate | ≈ 400 Gb/s (bare READ measured 392 Gbps) |
| OS / kernel | Linux 5.4.241-1-tlinux4-0017.7, x86_64, glibc 2.35 |
| CPU | 2 × AMD EPYC 9K84, 96 cores/socket (192 cores / 384 threads) |
| Host RAM | 2.2 TB (≈ 1.16 TB per NUMA node) |
| NUMA topology | 2 nodes; NICs 1–4 → node 0, 5–8 → node 1; node distance 10 (local) / 32 (remote) |
| NIC model / FW | Mellanox ConnectX-7 (board MT_0000000834), FW 28.39.1002 |
| rdma-core / OFED | MLNX_OFED 5.8-2.0.3.0 |
| PeerCache | 0.5.x (RDMA build) |
| Transport | --protocol rdma, layout mla |
Commands to capture the environment (fill in the blanks)
# NIC model, firmware, link rate, MTU
ibv_devinfo -d mlx5_bond_1 -v | grep -Ei "hca_id|fw_ver|active_mtu|rate|board"
# RoCEv2 GID table (confirm the v2 IPv4 index)
show_gids mlx5_bond_1
# NIC <-> NUMA node mapping
for d in mlx5_bond_{1..8}; do echo -n "$d numa="; cat /sys/class/infiniband/$d/device/numa_node; done
# CPU / NUMA topology and RAM
lscpu | grep -Ei "model name|socket|numa|core"
numactl -H | head -20
free -g
# OFED / rdma-core
ofed_info -s 2>/dev/null || rpm -q rdma-core 2>/dev/null || dpkg -l | grep -i rdma-core
uname -r
1 · Single NIC — PeerCache vs. bare RDMA
To bound what the storage layer costs, compare one NIC under PeerCache against the raw fabric:
| measurement | GET throughput |
|---|---|
ib_read_bw -q 16 -s 131072 (bare one-sided READ) |
49.0 GB/s (392 Gbps) |
| PeerCache GET, 128 KiB pages, 8 proc × 4 threads | 46.0 GB/s (368 Gbps) |
PeerCache lands within ~6% of bare ib_read_bw. That gap is the directory
lookup + per-batch orchestration; with --dir-cache-ttl enabled the directory
RPC is amortised away on a hot, static working set.
2 · Single process, many NICs (multi-rail)
Set --devices d1,…,d8 and one process opens a rail per NIC and stripes
each batch of READs across all of them in one GIL-released C++ call
(batch_read_multi).
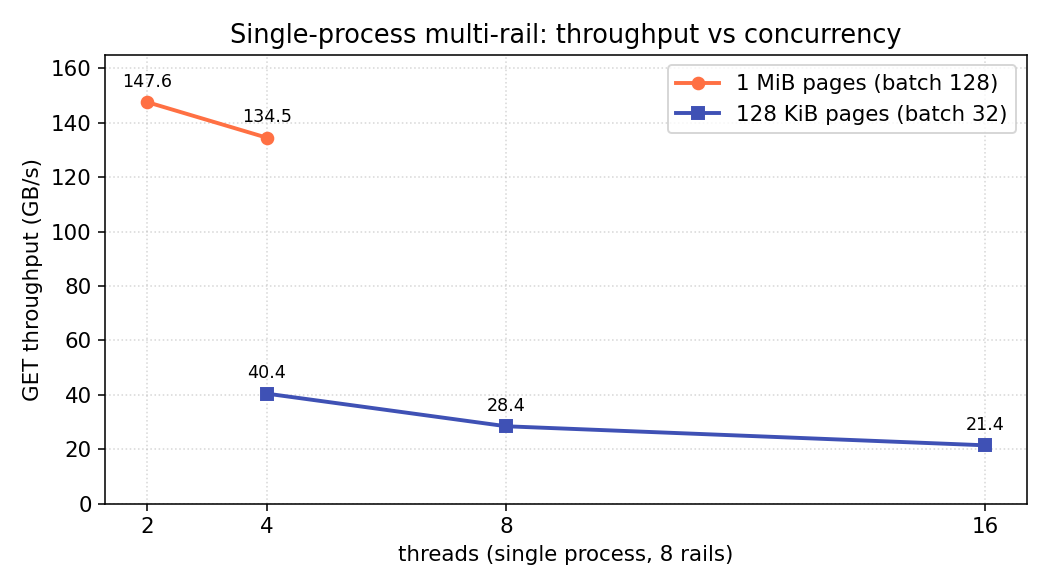
| page size | batch | peak | best thread count |
|---|---|---|---|
| 128 KiB | 32 | 40.4 GB/s | 4 |
| 1 MiB | 128 | 147.6 GB/s | 2 |
Two things stand out:
- A single process is GIL-bounded. Throughput peaks at a low thread count (2–4) and drops as threads increase — the per-batch Python orchestration is serialised by the GIL, so extra threads only add contention.
- Bigger transfers amortise that overhead. The GIL-held work is per call, not per byte, so going from 128 KiB to 1 MiB pages lifts a single process from 40 → 148 GB/s (≈ 3 NICs' worth) — even though both are GIL-bounded.
So multi-rail lets one process use several NICs, but one Python process cannot saturate all 8 — for that, use multiple processes.
3 · Full machine — multi-process across 8 NICs
The production shape (and the way to fill every NIC) is one process group per NIC — exactly how an SGLang TP=8 deployment runs (8 ranks, each pinned to its local NIC). Here: 8 NICs × 8 reader processes each, 128 KiB pages.
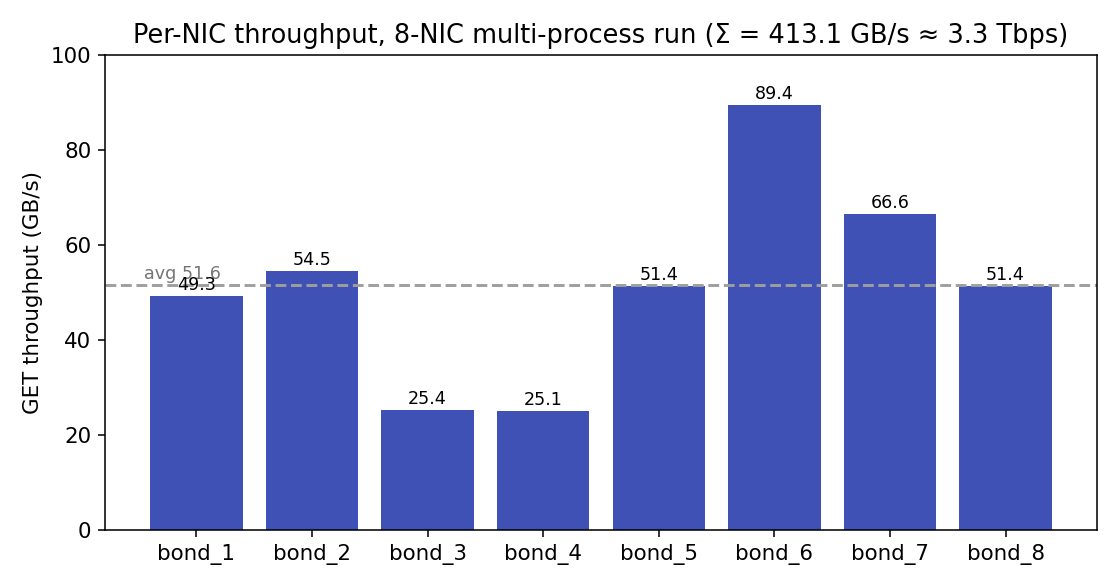
| metric | value |
|---|---|
| Aggregate GET | 413.1 GB/s (3.3 Tbps) |
| Per-NIC range | 25.1 – 89.4 GB/s (avg ≈ 51.6) |
| Config | 8 NICs × 8 reader processes, 128 KiB pages |
The aggregate scales far past a single process (147 → 413 GB/s) and a single NIC
reached 89 GB/s here, so it is not NIC-bound — the limit is host memory
bandwidth / PCIe and an imbalance (two NICs at ~25 GB/s while others reach
49–89). On this box NICs 1–4 sit on NUMA node 0 and 5–8 on node 1 (remote-node
distance 32 vs 10 local),
so a reader that isn't pinned can land on the wrong node and pay the cross-NUMA
penalty. Bind each process group to its NIC's NUMA node with
numactl --cpunodebind=<n> --membind=<n> (the reproduce scripts do this when
numactl is installed) and verify both bond slaves carry traffic; this is
expected to recover the slow NICs and lift the aggregate.
Key takeaways
- Single NIC: PeerCache ≈ 94% of bare
ib_read_bw— the RDMA path is near-optimal. - GIL is the single-process ceiling. Use low thread counts and large batches/pages to maximise one process; it cannot fill all NICs alone.
- Full-machine bandwidth needs multiple processes (one group per NIC). This matches the SGLang multi-rank deployment model.
- Above ~one NIC, the bottleneck shifts to memory/PCIe/NUMA, not the fabric — pin to NUMA and balance the bond.
Reproduce
Install the RDMA build on both hosts (pip install -U peercache). Replace the
device list with your NIC names and PRODUCER_IP with the data node's address.
Single process, 8 rails (one box drives many NICs):
# producer (data node)
peercache-bench serve --discovery-addr 0.0.0.0:31998 \
    --devices mlx5_bond_1,mlx5_bond_2,mlx5_bond_3,mlx5_bond_4,mlx5_bond_5,mlx5_bond_6,mlx5_bond_7,mlx5_bond_8 \
    --layout mla --page-size 1048576 --working-set 8192 --readers 1

# consumer (driver)
peercache-bench drive --discovery-addr PRODUCER_IP:31998 \
    --devices mlx5_bond_1,mlx5_bond_2,mlx5_bond_3,mlx5_bond_4,mlx5_bond_5,mlx5_bond_6,mlx5_bond_7,mlx5_bond_8 \
    --layout mla --page-size 1048576 --working-set 8192 \
    --batch-size 128 --concurrencies 2 --max-channels 32 \
    --dir-cache-ttl 5 --duration 10 --warmup 2 --op get
Full machine, one process group per NIC (aggregate): start one
serve/drive pair per device on its own discovery port (31998+i), NUMA-bind
each pair, run them in parallel and sum the per-NIC GB/s. A ready-to-run
launcher loop is in the
bench README.
The figures on this page are generated by
docs/assets/perf/make_charts.py;
update the data points there when you refresh the baseline.
GPUDirect RDMA (reading into GPU memory)
In a real SGLang deployment the KV buffer lives in GPU memory. PeerCache can register that buffer and have the one-sided READ land directly in VRAM (no host bounce):
- if the buffer exposes a dmabuf fd, it is registered via
ibv_reg_dmabuf_mr; - otherwise the device virtual address is registered with a plain MR, which
works when
nvidia-peermem(peer memory) is loaded.
Prerequisites on the host: a GPUDirect-capable NIC + driver (ConnectX + MOFED,
and either nvidia-peermem loaded or a dmabuf-capable stack). Measure it with:
peercache-bench drive --discovery-addr PRODUCER_IP:31998 --device-name mlx5_bond_1 \
    --layout mla --page-size 131072 --working-set 4096 \
    --batch-size 32 --concurrencies 4 --duration 10 --warmup 2 --op get --gpu
--gpu allocates the read destination in GPU memory; a registration failure
raises an error naming the missing prerequisite.
Measured (1 process, 8 rails, 1 MiB pages, recv in VRAM): 49.5 GB/s at 100% hit vs. 140 GB/s with a host recv buffer. This is single-GPU PCIe-bound — all 8 rails write into one GPU, so they share that GPU's PCIe link (≈ 50 GB/s on Gen5 x16). In a real SGLang TP=N deployment each rank reads into its own GPU, so GPUDirect scales with the number of GPUs (≈ N × per-GPU PCIe bandwidth) instead of being capped by a single link.
Caveats
- 1 MiB pages are synthetic. Real MLA KV pages are typically ~128 KiB; the 1 MiB runs show headroom when transfers are large, not a production page size. Quote the page size next to any number.
- Cross-node only. Single-host runs use NIC loopback and are software-bound; they don't represent fabric behaviour.
- TCP is not a performance scenario — it exists only for functional testing.
- Always publish the run's
host+metablock (device list, layout, page, batch, concurrency, processes) next to any figure.